 Branding
 Digital Marketing
 Web & App Dev
 IT Services
Does Your Bounce Rate Suck? Segment and See

Ah, the mysterious Bounce Rate. Here’s the official definition from Google Analytics: Bounce rate is the percentage of visits that go only one page before exiting a site. In other words, the percentage of visitors who came, looked at one page, and left.
Bounce rate is an indicator of the quality of traffic you’re attracting to your site. If your marketing efforts are reaching the right type of customer, they should be interested in what your website has to say. They should be clicking on to more pages, or a call to action (CTA) or staying to read for longer than a few seconds.
If you ask about ‘typical’ bounce rates, you might find statistics such as this from Google Analytics Benchmark Averages for Bounce Rate:
- 10-30% Service sites
- 20-40% Retail sites
- 30-50% Lead generation sites
- 40-60% Content websites
- 70-98% Blogs
- 70-90% Landing pages
Every website is different, and every industry is different. Plus, you should never look at any one big undifferentiated metric in isolation, especially one like bounce rate which can be both meaningful and totally meaningless. So, how can you deal with bounce rate to get the most useful actionable insights? There are lots of techniques for interpreting bounce rate, but for today, let’s focus on segmenting
-
Segment your data
One way to get down to actionable insights is to segment your data. Consider how these factors could affect your bounce rate:
Location:
What’s your business territory? If you are BC-only or Canada-only, you’ll get a high bounce rate from out-of-province or non-Canadian traffic. If you are a local business, you should definitely segment your traffic avoid your numbers being skewed by irrelevant visits – and this segmentation is useful beyond bounce rate. If you’re global, are there specific territories you want to track more closely?New versus Returning:
New visitors are less familiar with your brand, so this segment will have a higher bounce rate. Returning visitors usually have a purpose in coming back to your site. Segment to differentiate between these types of visitors and it will be easier to analyze how you can increase your website’s ‘stickiness’ for each group.If nothing else, segment your blog pages by New and Returning. You want to be able to track how well your content is engaging new visitors.
Technology and Device:
This segmentation matters more and more as the percentage of people who use their smartphones as their primary browser goes up. Unless your website is optimized for mobile users, expect high bounce rates from that segment. Plus, mobile users typically interact for shorter periods of time – usually they just want to look up some information and get back to other activities.Traffic source:
Did the visitor come to your site from a social media site, a partner referral link, directly (typed in your URL), organic search, or paid search? They will have different expectations and varying levels of familiarity with your brand, so don’t be surprised by how wildly bounce rates vary between segments.Google Analytics allows you to segment by these segments. Which ones would be most meaningful to you?
Direct Traffic
Mobile Traffic
New Visitors
Non-bounce Visits
Non-paid Search Traffic
Paid Search Traffic
Referral Traffic
Returning Visitors
Search Traffic
Visits with Conversions
-
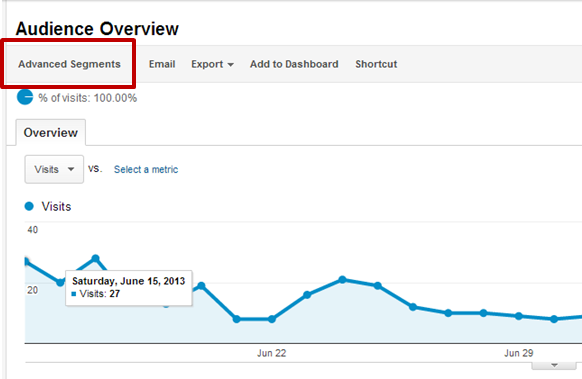
Where Can You Find Advanced Segments in Google Analytics?
Just look at the top of any Analytics report and in the bar below the title and date, you’ll see a tab for Advanced Segments.
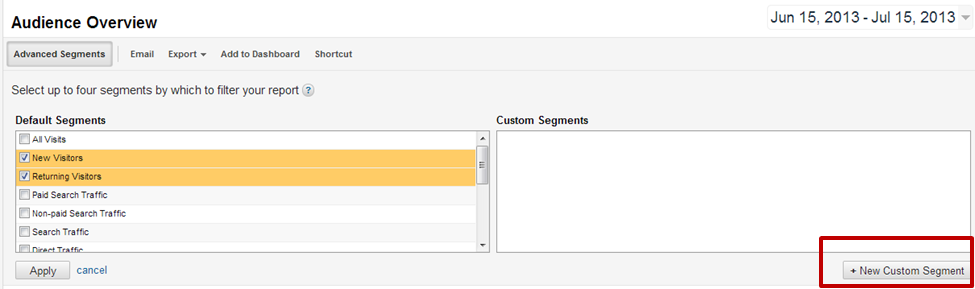
Click on this tab and you’ll be able to select some default segments, and then apply New Custom Segments within each of the default segments.
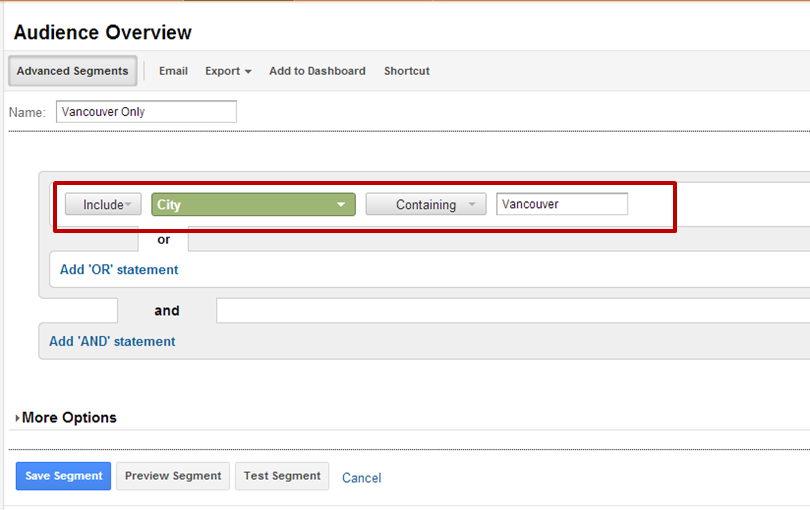
In the example below, we are segmenting by City containing ‘Vancouver’.
-
Take Action
You can take action once you determine what you need to investigate. With segmentation, you’ll be able to see your issues more clearly and finding yourself asking questions such as:
- Which sources are sending you poor quality traffic?
- What is the CTA on those sites that is getting unqualified visitors to click through?
- Is this a generic link to your Home page? Would links to specific information pages be more relevant to that audience?
- Are these sites partners or affiliates who would be willing to revise copy on their site?
- Is a PPC marketing campaign that’s yielding high bounce rates?
- For organic search sources, which keywords deliver a high or low percentage of bounces?
Track this over time and you’ll be able to see whether paid search campaigns, organic SEO, or social media have improved the quality of traffic for their respective segments.
As a final reminder, bounce rate is only one indicator of traffic quality and segmentation is the starting point for helping you interpret that data. However, segmentation is a technique that is useful in nearly every data analysis situation. It’s hard to validate one big undifferentiated blob of customer behavior – so segment and see! Get more granular!

