 Branding
 Digital Marketing
 IT Services
 Web & App Dev
Use Digital Marketing Metrics to Avoid “Trial and Error” Syndrome

Digital marketing is a channel where every interaction can be tracked from start to finish, and with full attribution. And yet here we are a decade down the road of online marketing and most marketing departments seem unable to take advantage of the wealth of data generated by digital marketing. (Related article: Stay on Top of Negative Keywords).
Adobe’s survey (Sept. 2013) of marketing professionals, titled Digital Distress found that:
- 61% feel they are ill-equipped to take advantage of new marketing technologies and describe their digital marketing efforts as ‘trial and error’, and
- 37% suffer from pace of change, they feel overwhelmed by the continuous churn of new trends, tools, and technologies that characterize online.
For insight into marketers’ frustrations, take a look at some stats from a January 2014 study sponsored by NetBase. Marketing professionals rated the top three challenges when it came to actually measuring social media success:
- Lack of staff, funding, or resources - 55%
- Ability to link measurements to objectives - 53%
- Defining meaningful measurements - 48%
The first issue points to a skills shortage in digital marketing as teams try to acquire, learn, build, or outsource what they need. But that’s a topic for another day.
The last two challenges suggest that teams find metrics confusing – possibly because the pace of change mentioned above can be so distracting. There’s always something new to consider. But digital marketing is just another channel. The foundational ideas don’t change.
Successful digital marketing, when supported by data, is not “trial and error”. It’s a series of informed, incremental improvements. So if you want to avoid that “trial and error” feeling when you’re doing your planning, take a deep breath, step back and apply the same structured thinking to a digital campaign as you would to any other. Then think about appropriate metrics.
Let’s follow through using a B2B example based on a company that manufactures commercial HVAC systems.
-
What’s Your Business Objective?
Sounds familiar, right? Why are you even running this campaign or enhancing your website or developing a series of how-to videos? Let’s say the objective for your marketing program is to create awareness and generate leads.
-
What are Your Business Goals?
Still pretty basic marketing. What goals do you have for each objective? Let’s say that for:
- Create awareness: you want to expand your visibility beyond your current audience of builders and out to people who influence materials and building features such as: HVAC technicians, engineers and architects.
- Lead generation: you want to move to the next level and start using paid search engine marketing to address each of those audiences.
Then start thinking about which channels you would use. For example:
- To create awareness, you might develop a social media program that focuses on industry-oriented social platforms such as LinkedIn or Facebook groups or professional forums for technicians, engineers, builders, and architects.
- For lead generation, you might run a series of Google pay-per-click (PPC) campaigns that target each of those audiences.
Why are we thinking ahead to channels at this point? Because the next step is to define your metrics for success. Those metrics must be realistic and measurable, and a lot of that depends on the channel.
-
KPIs: the Metrics that Matter
This is where a lot of teams lose their way in digital marketing. Just what are those all-important key performance indicators (KPIs)? A tool such as Google Analytics pumps out a mind-boggling amount of data. But how do you select the ones that matter? How do you connect those data points to your goals? More importantly, what sort of useful insights can you derive?
Number of visitors? Page views? Bounce rate? Most of the straight data that GA provides is “top of funnel” information that doesn’t differentiate visitor behaviours. Unless a metric, or group of metrics, delivers insights that help you improve your results, they’re not worth monitoring. Your KPIs need to relate to your desired outcome.
Moving along with our example:
- Create awareness using social media: You may start out by looking at web traffic stats such as Traffic Source, and see that your social media initiatives are driving more traffic as well as a larger share of traffic to your website. That’s a good starting data point. But does that tell you anything about the quality of relationships you’re building? Does the number of friends or followers matter as much as having them actually pay attention to you? That’s your real desired outcome. Call it “engagement rates”.
For that, you need to look at data such as: number of comments to your blog, LinkedIn posts, or Facebook posts. If your main social media channel is LinkedIn, how many comments do you get from posting on LinkedIn? How many shares? You want KPIs that are realistic as well as measurable:
• # comments per blog (link to your blog from LinkedIn)
• # LinkedIn discussions shared - Use paid search for lead generation: In any PPC campaign, a straight conversion rate is easy to calculate. It’s all about the call-to-action (CTA) on the landing page. For example: “Download this coupon for a discount on our next training course”. Conversion is binary: did the visitor download or not? If yes, it’s a lead. Your leading KPI is conversion rate:
Conversion rate = total number of leads/number of click-throughs per campaign time interval
Sound too simple? Read on.
- Create awareness using social media: You may start out by looking at web traffic stats such as Traffic Source, and see that your social media initiatives are driving more traffic as well as a larger share of traffic to your website. That’s a good starting data point. But does that tell you anything about the quality of relationships you’re building? Does the number of friends or followers matter as much as having them actually pay attention to you? That’s your real desired outcome. Call it “engagement rates”.
-
Set Targets for Your KPIs
There are industry averages you can use as benchmarks, but honestly, the best way to set KPI targets is to know where you stand right now, before you make any website changes or run a campaign. If you are not collecting analytics data, you need to install Google Analytics and get started. For data outside the scope of GA, jot them down manually if you have to, or enter in a spreadsheet.
- Create awareness using social media: for this one, your targets could be:
• 5 comments per blog
• Increase # LinkedIn discussions shared by 5% each quarter - Use paid search for lead generation: you might have run an offline campaign a year ago and you’re now adapting the content of that campaign for PPC, so:
• 15% more leads than the offline campaign
- Create awareness using social media: for this one, your targets could be:
-
Get Actionable Insights from Data
Avoid “trial and error” with actionable insights backed up by objective data. Digital marketing is a process of continuous improvements that lead to ROI. If you’re not meeting your targets, dig deeper to the data that helps you understand how to improve your results. Here are some ideas for information that goes beyond the “top of funnel” standard analytics stats:
- Create awareness using social media: Which blog posts received the most attention? Which got the least? Do your most successful engagements have anything in common? This could be a sign that you need to tweak either your content or your tone.
What you can discover about the people who are engaging in social media conversation with you? Do they belong to your target audience? Or are they students and consultants? (This is not entirely a bad thing longer-term. Students graduate and get jobs. Consultants can be influencers). If you’re getting good engagement rates but they’re from the wrong audience, this could mean it’s time to review your strategy. Is it your content? Or have you picked the wrong social media channels? - Use paid search for lead generation: Let’s say your conversion rate is below your KPI target. Your desired outcome is to achieve your target. Another desired outcome might be to learn from this experience for the next one. So you need more metrics. Yes, straight conversion rate is too simple.
What path did your leads take before clicking on that CTA? Do you know for sure that every lead took a straight line from your PPC ad to the CTA? What if you knew that 50% of leads had gone away and come back later to click on the CTA? Wouldn’t you want to know what they were doing before they made the decision? What did they see before they took you up on your offer? What did other visitors see or not see that made them decide not to click on the CTA?
In this situation, you need to set up a multi-channel funnel to understand the total impact of all channels such as: paid ads, unpaid organic searches, social media, and other referral websites. An attribution model gives credit to all the channels that helped conversion, which helps you fine tune your campaign. For example:
- Which keywords delivered the most direct conversions? Were any of these a surprise? Does this information suggest other productive keywords you could be using for this campaign?
- For the visitors who did not convert into leads, what was their final interaction? Was it a visit to your website? This could indicate that the offer or promise on your landing page is not supported by your website’s messaging and content.
- Was there a social media or other referral site that showed up as assisting frequently with conversions? If so, should you be investing more in those channels?
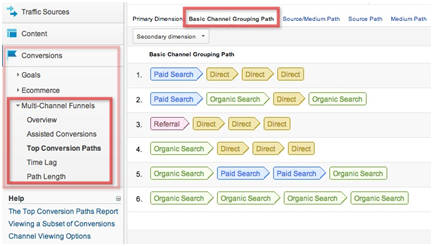 Figure 1: A multi-channel funnel shows how other factors besides Paid Search played a role in conversion.
Image credit: Clickinsight.caEven if you achieve your target KPI, you still want to maximize the value of the experience. You want quantifiable data that helps you develop a more successful PPC campaign next time, so make the effort to set up multi-channel funnels and capture all the touch points that contribute to conversion.
- Create awareness using social media: Which blog posts received the most attention? Which got the least? Do your most successful engagements have anything in common? This could be a sign that you need to tweak either your content or your tone.
Avoid “Trial and Error” by Planning Ahead for Metrics
From the discussion above, you can see how thought and planning for metrics helps you set up data collection proactively. Consider in advance all the information you need to analyze why something isn’t working, not halfway through a campaign. Avoid that moment when you smack yourself across the forehead and exclaim “We need to know the percentage of visitors who converted immediately versus a week later!”
To get away from “trial and error” tactics, avoid metrics that don’t add value. They just muddy the waters. Select the ones that deliver insights. Superficial, overview data such as “average page views” or “traffic source” tell only a small part of the story. Begin by thinking through your goals and desired outcomes, then select the metrics that translate to meaningful and actionable insights such as: engagement rate, loyalty, or time-to-commit.
If your team needs more knowledge, attend Smartt's Google Analytics training workshop or P.A.C.E. digital marketing workshop. If you want to add pay-per-click campaigns to your marketing effort, we offer campaign planning, execution, and management.

